OCT Technology Development
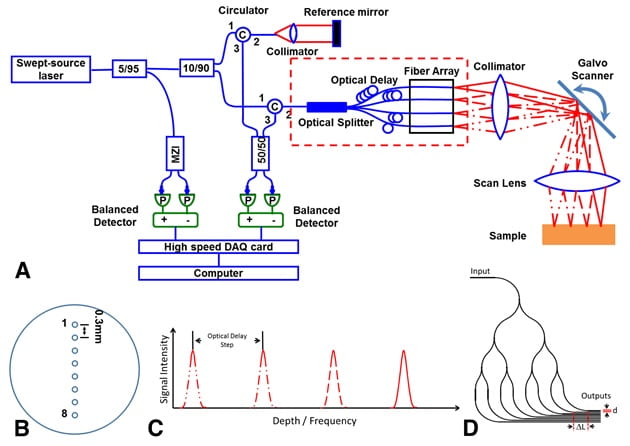
High speed, high resolution and high sensitivity are desirable for optical coherence tomography (OCT). We demonstrate space-division multiplexing (SDM) technology that translates long coherence length of a commercially available wavelength tunable laser into high OCT imaging speed (parallel OCT). In our 1st generation SDM-OCT system, we achieved an effective 800,000 A-scans/s imaging speed using a 100,000 Hz tunable vertical cavity surface-emitting laser (VCSEL). A sensitivity of 94.6 dB and a roll-off of < 2 dB over ~30 mm imaging depth were measured from a single channel. An axial resolution of ~11 μm in the air (or ~8.3 μm in tissue) was achieved throughout the entire depth range.
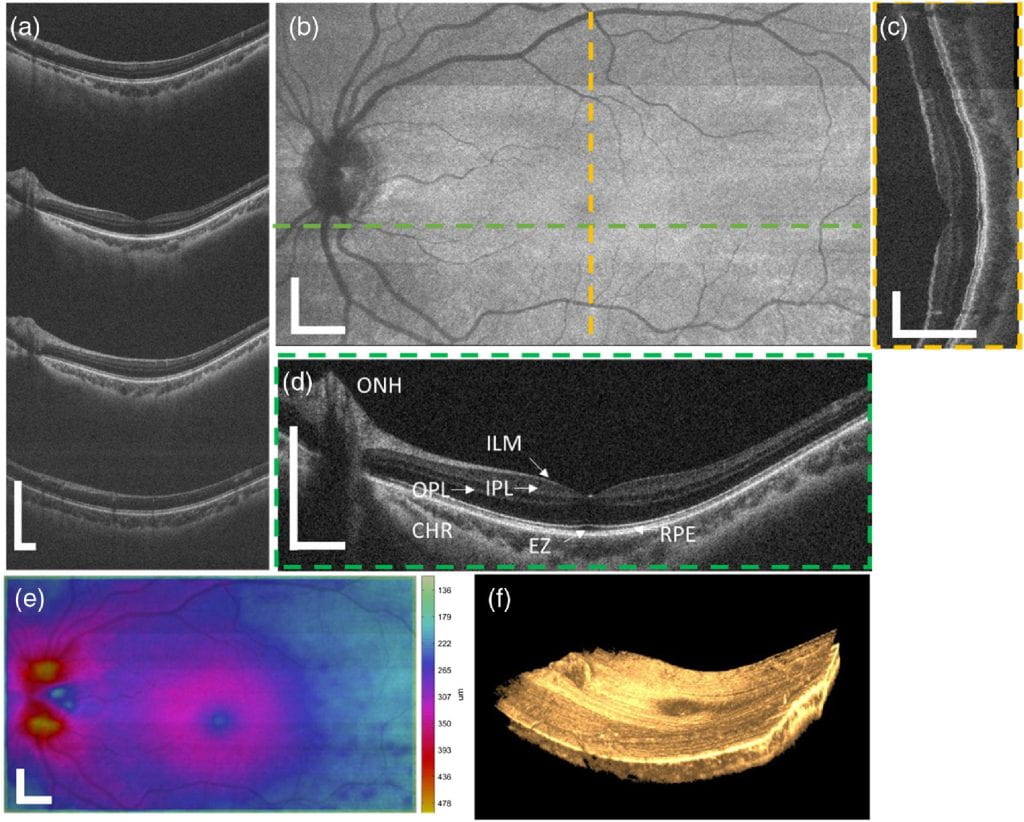
With the high-speed SDM-OCT imaging technology, we demonstrate wide-field retinal OCT imaging working around 1060 nm, acquired at an effective A-scan rate of 800,000 A-scans/s with volumetric images covering up to 12.5 mm × 7.4 mm on the retina and captured in less than 1 s. A clinical feasibility study was conducted to compare the ophthalmic SDM-OCT with commercial OCT systems, illustrating the high-speed capability of SDM-OCT in a clinical setting.
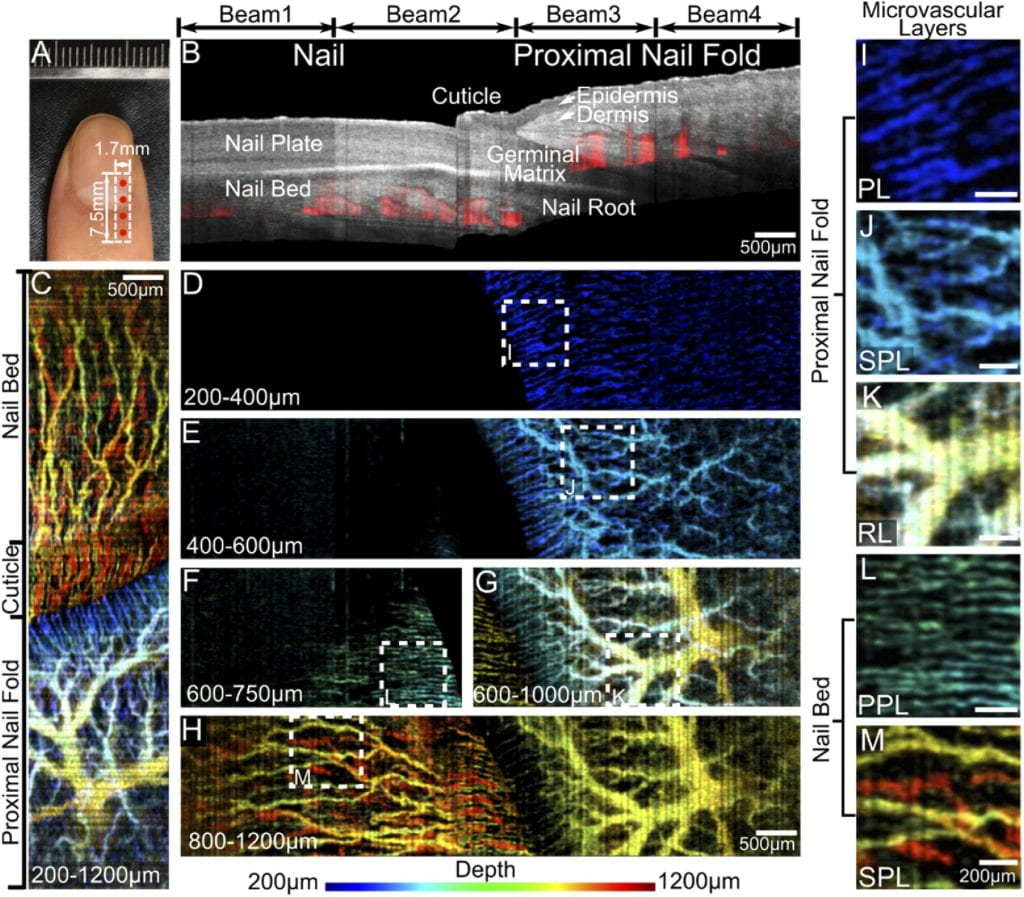
In standard FD-OCT, A-scan signals are detected as spectral fringes based on wavelength. Post-processing involves reconstructing sample intensity profiles via inverse Fourier transform (IFT) along the depth. Since detected spectral fringes contain real values only, their IFT results are Hermitian. When sample signals range across the zero delay, they will overlap with their complex conjugates, causing the unwanted blurring of the sample signals, denoted as complex conjugate ambiguity. Full-range techniques reconstruct complex fringes, eliminating conjugate terms, and then double the whole imaging range. We demonstrated a full-range space-division multiplexing optical coherence tomography (FR-SDM-OCT) system, utilizing the galvanometer-based phase modulation full-range technique. We demonstrated the feasibility of FR-SDM-OCT angiography to perform simultaneous acquisition of human fingernail angiograms from four positions. FR-SDM-OCT creates new opportunities to apply SDM-OCT to obtain wide-field angiography of in vivo tissue samples free of labeling.
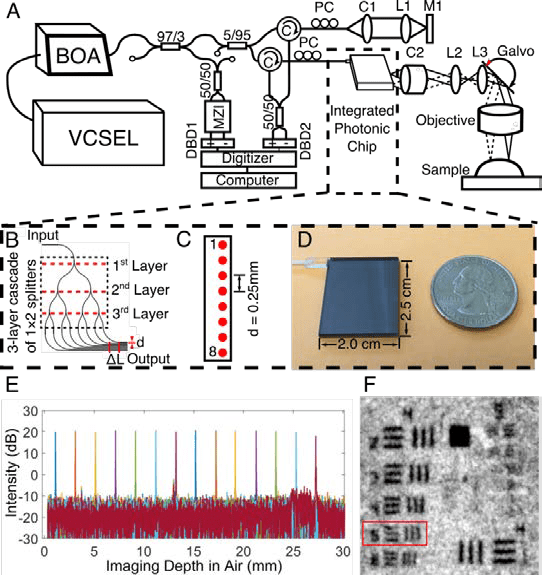
Space-division multiplexing optical coherence tomography (SDM-OCT) is a recently developed parallel OCT imaging method in order to achieve multi-fold speed improvement. However, the assembly of fiber optics components used in the first prototype system was labor-intensive and susceptible to errors. Here, we demonstrate a high-speed SDM-OCT system using an integrated photonic chip working at around 1310 nm that can be reliably manufactured with high precisions and low per-unit cost. A three-layer cascade of 1 × 2 beam splitters was integrated in the photonic chip to split the incident light into 8 parallel imaging channels with ~3.7 mm optical delay in air between each channel. High-speed imaging (~1s/volume) of porcine eyes ex vivo and wide-field imaging (~18.0 × 14.3 mm2) of human fingers in vivo were demonstrated with the chip-based SDM-OCT system.
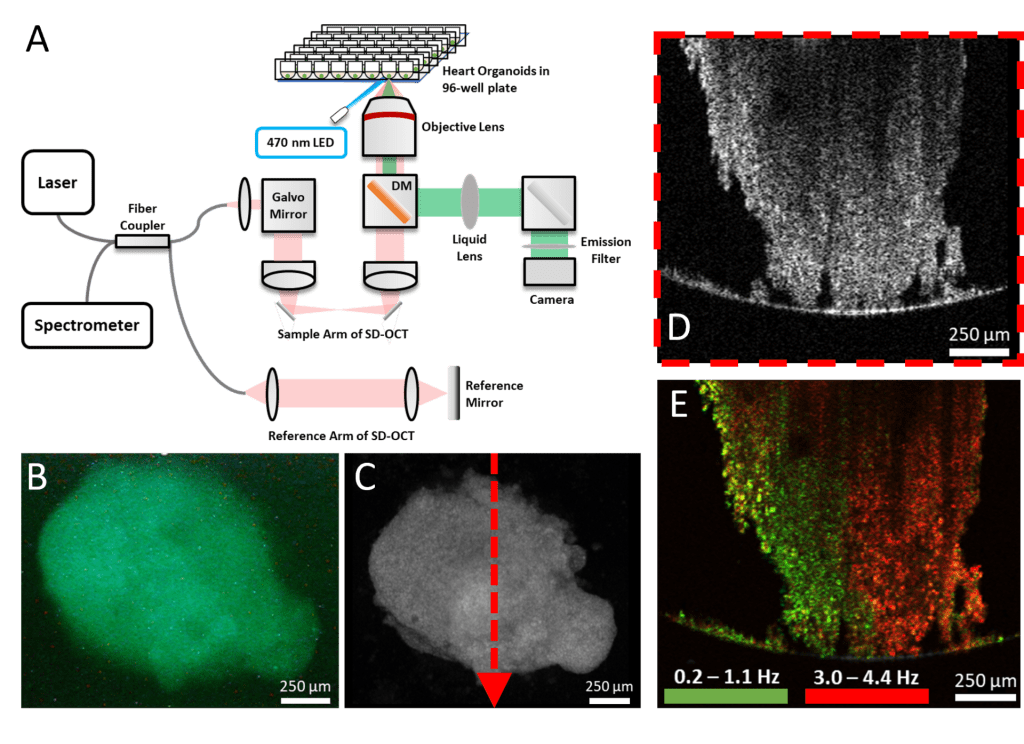
To reveal the three-dimensional microstructure and calcium dynamics of human heart organoids (hHOs), we developed a dual-modality imaging system combining the advantages of optical coherence tomography (OCT) and fluorescence microscopy. OCT provides high-resolution volumetric structural information, while fluorescence imaging indicates the electrophysiology of the hHOs’ beating behavior. We verified that concurrent OCT motion mode (M-mode) and calcium imaging retrieved the same beating pattern from the heart organoids. We further applied dynamic contrast OCT (DyC-OCT) analysis to strengthen the verification and localize the beating clusters inside the hHOs. This imaging platform provides a powerful tool for studying and assessing hHOs in vitro, with potential applications in disease modeling and drug screening.
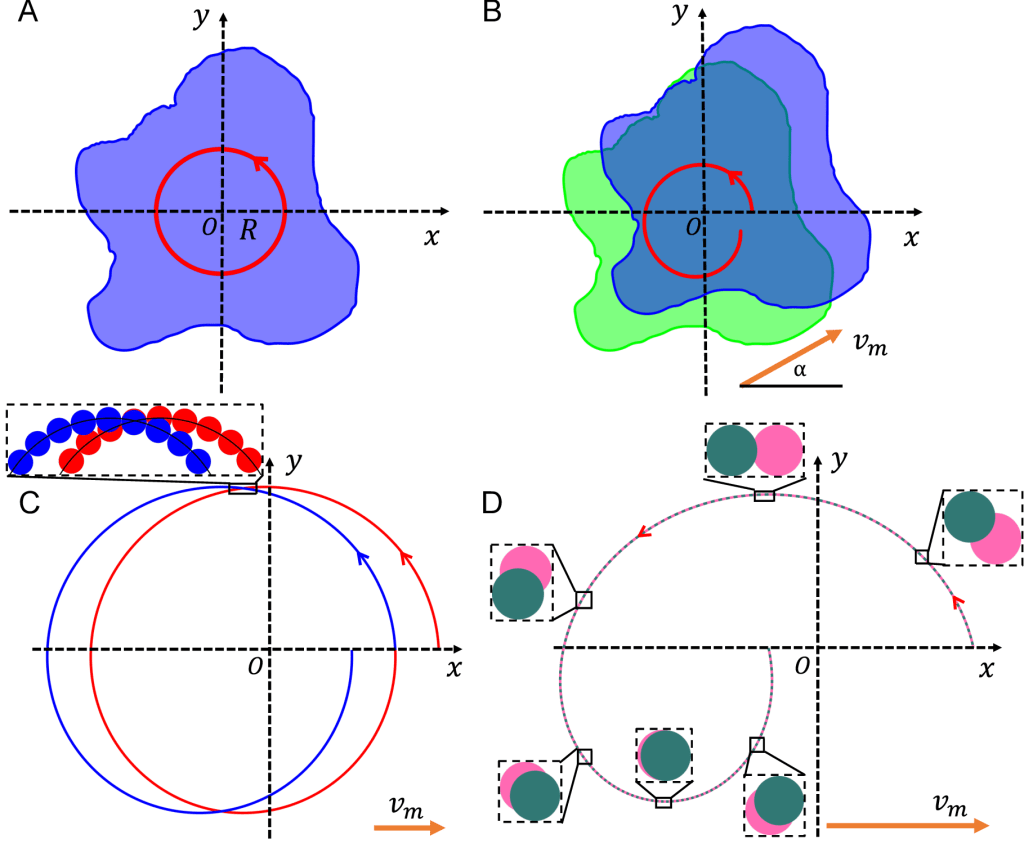
Motion artifacts, from such sources as heartbeats, respiration, or peristalsis, often degrade microscopic images or videos of live subjects. We have developed a method using circular optical coherence tomography (OCT) scans to track the transverse and axial motion of biological samples at speeds ranging from several micrometers per second to several centimeters per second. We achieve fast and high-precision measurements of the magnitude and direction of the sample’s motion by adaptively controlling the circular scan pattern settings and applying interframe and intraframe analyses. These measurements are the basis of active motion compensation via feedback control for future in vivo microscopic and macroscopic imaging applications.
Optogenetics
Our laboratory plays a pivotal role in advancing noninvasive cardiac pacing methods through the fusion of Optical Coherence Tomography (OCT) and optogenetics, all within the versatile model organism, Drosophila melanogaster. This innovative approach allows researchers to regulate heart function without invasive procedures, significantly advancing the field of cardiac optogenetics. The utilization of Drosophila as a model organism offers a powerful genetic system for cardiovascular studies, ensuring significant progress in various biological science areas, from cellular organization to modeling human heart disorders, thereby providing invaluable insights into cardiac research and disease modeling.
Ref: A. Alex, et al. Optogenetic pacing in Drosophila melanogaster, Science Advances, 1:e1500639, 2015.
In 2015, our lab introduced a noninvasive cardiac pacing method utilizing optogenetics, specifically channelrhodopsin-2 (ChR2), to control heart rhythm in Drosophila at different developmental stages. By employing high-speed optical coherence microscopy, they successfully monitor cardiac function noninvasively, providing a powerful platform for developmental cardiology research. Figure X-1 illustrates optogenetic pacing of the Drosophila heart using an integrated OCM system (A), showing differences in cardiac mCherry expression (B), and successful pacing in ChR2 flies (C), while control hearts remained unresponsive.
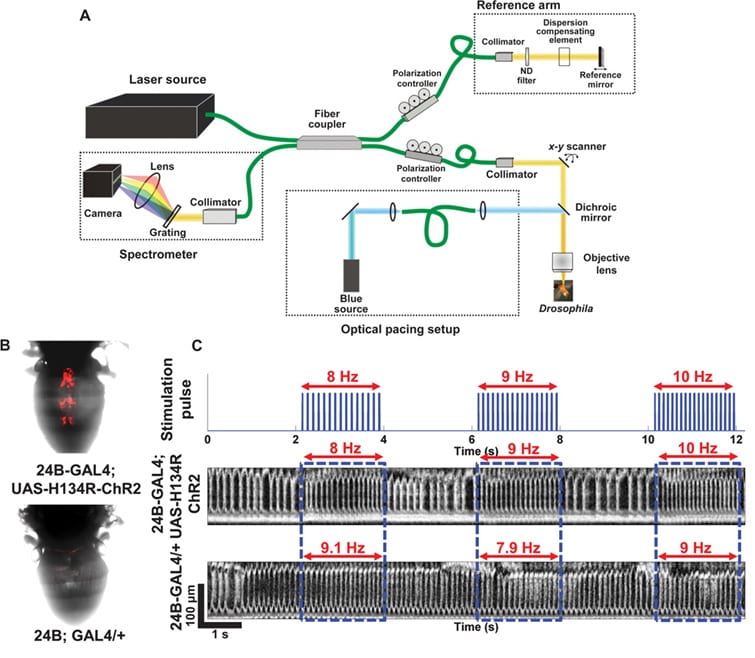
(A) Schematic of the integrated OCM imaging and pacing system. The optogenetic excitation beam was coupled with the sample arm of the spectral domain OCM system using a dichroic beam splitter.
(B) Comparison of cardiac-specific mCherry fluorescence expression between ChR2-expressing transgenic flies (24B-GAL4;UAS-H134R-ChR2) and control flies (24B-GAL4/+).
(C) M-mode images showing optogenetic pacing in ChR2 and control adult flies. The ChR2 fly heart with an RHR of 6 Hz was successfully paced at three different frequencies: 8, 9, and 10 Hz. In comparison, the control fly heart was not responsive to optical pacing stimulations.
Our lab then expanded on this work by developing a red-light-sensitive opsin system, enabling more efficient and less invasive cardiac pacing while also offering recovery dynamics observation. This advancement in pacing efficiency and reduced power requirements signifies a substantial step forward in noninvasive cardiac optogenetic studies. Figure X-2 shows that the utilization of red light for cardiac control in Drosophila expressing ReaChR or NpHR holds significance due to the lower amplitude, shorter pulse width, and deeper penetration depth when compared to blue light, offering versatile pacing strategies such as tachycardia, cardiac arrest, and bradycardia for comprehensive heart function studies.
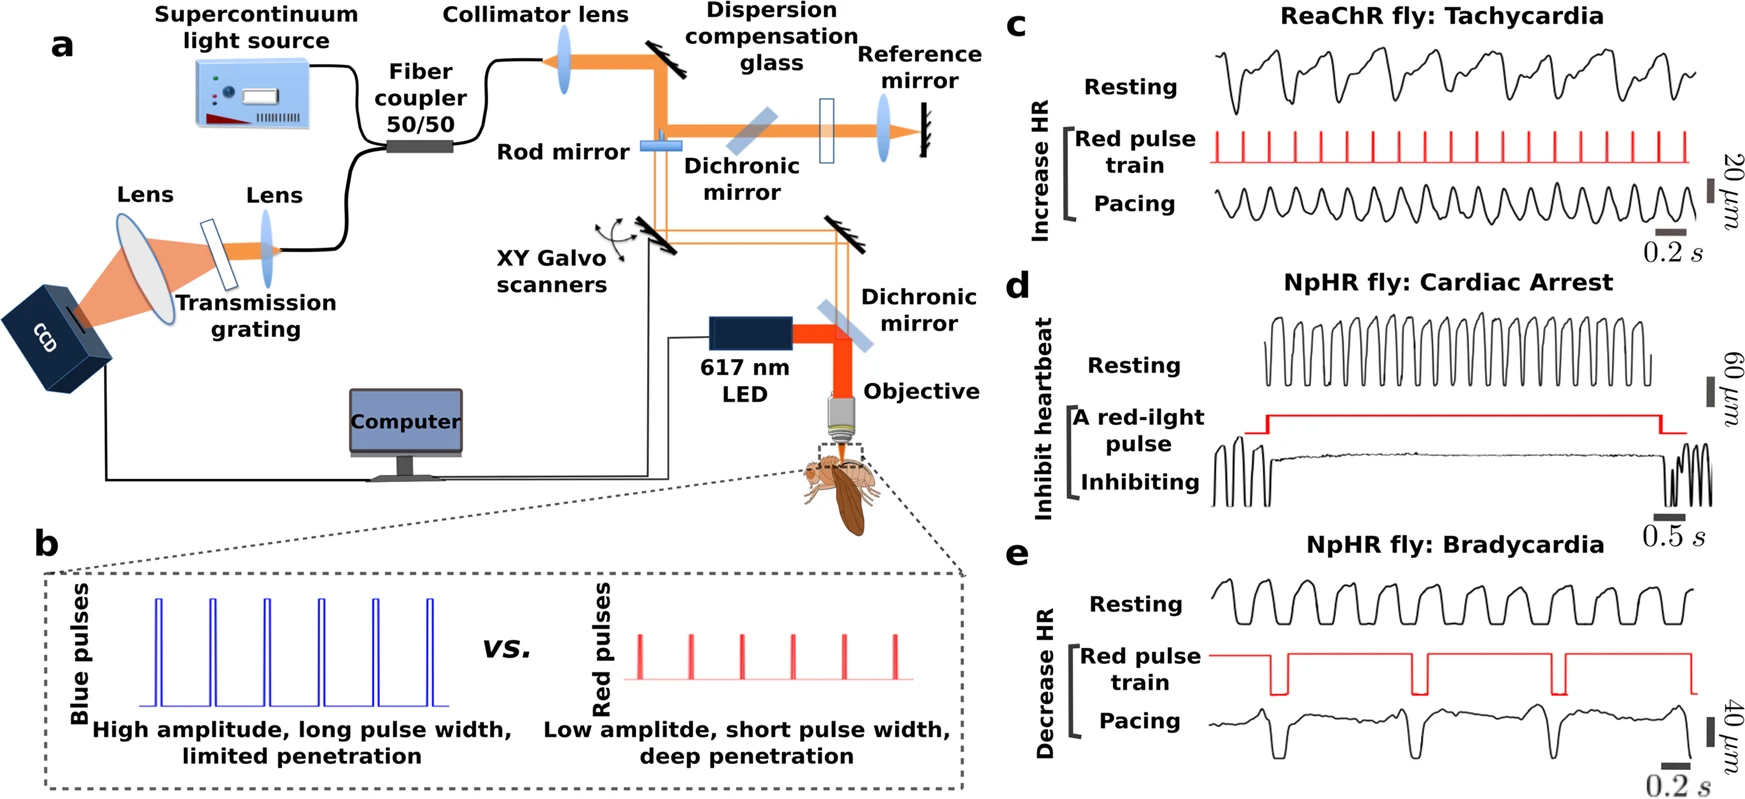
(a) Schematic illustration of the integrated red-light stimulation and OCM imaging system.
(b) Comparison of red-light and blue-light pulses, showing that red light has a lower amplitude, shorter pulse width, and deeper penetration depth for achieving cardiac pacing in Drosophila melanogaster.
(c-e) Three pacing strategies for red-light cardiac control. For each strategy, the upper trace shows the heart pulse change with time in the axial direction during rest. The middle trace shows the red-light pulse used for cardiac stimulation, and the lower trace shows heart pulse change with time in the axial direction with optical excitation. (c) The heart pulse changes with time show an increasing heart rate (HR), mimicing tachycardia through red-light pacing of a ReaChR fly. (d) Heart diameter changes with time to indicate inhibition of NpHR fly cardiac function for 10 s to mimic cardiac arrest through red-light excitation. (e) Heart pulse changes with time to demonstrate decreasing HR of a NpHR fly to simulate bradycardia through red-light excitation.
Building on our previous research, we have extended our efforts to develop an experimental system that offers a highly detailed protocol for the noninvasive assessment and precise control of Drosophila heart function using red light in conjunction with optogenetic techniques. Our lab’s methodological guide provides a comprehensive and detailed protocol for noninvasive evaluation and precise control of Drosophila heart function using red light and optogenetic tools. This resource simplifies the modeling of human heart disorders and is invaluable for researchers exploring cardiac disease within a living organism, emphasizing accessibility and simplicity for their investigations.
Developmental Biology
Human heart organoids (hHOs) have emerged as a groundbreaking tool in developmental biology and regenerative medicine. These miniature, self-assembled heart-like structures, derived from pluripotent stem cells, enable researchers to mimic human heart development and study congenital heart defects, which are the most common birth defects in humans. The ability to model cardiac development and dysfunction in vitro is invaluable, offering insights into the intricate processes of heart formation, disease mechanisms, and potential drug testing. Heart organoids bridge the gap between simplistic cell cultures and complex animal models, providing a more accurate representation of the human heart’s structural and functional intricacies. Consequently, they hold immense promise for advancing our understanding of cardiac biology and embryology, ultimately contributing to innovative approaches for tackling heart-related developmental disorders and diseases.
Optical Coherence Tomography (OCT) plays a pivotal role in monitoring the growth and development of heart organoids. Its non-invasive, high-resolution imaging capabilities allow researchers to track the structural and functional changes within these miniaturized hearts in real-time. OCT offers a unique advantage by providing label-free, 3D imaging, enabling the observation of organoid growth, chamber formation, and beating patterns. This technology contributes to the precision and efficiency of organoid analysis, enhancing our ability to study heart development and disease mechanisms in an in vitro setting.
Our lab has been progressively working on connecting OCT imaging with heart organoid development through our collaborative efforts.
In the paper published in 2021, we generated self-assembled human heart organoids from pluripotent stem cells. These organoids closely resemble human fetal cardiac tissues in terms of transcriptomic, structural, and cellular characteristics. They develop complex cardiac features, including internal chambers, multi-lineage cardiac cell types, and vasculature. Figure X-1 demonstrates various aspects of heart organoid development and function, including structural features, electrophysiology recordings, and calcium transients. Moreover, these heart organoids can mimic metabolic disorders associated with congenital heart defects. This research provides an essential tool for studying cardiac development and congenital heart diseases in vitro. It offers valuable insights into heart morphogenesis and paves the way for potential drug testing and disease modeling in a highly accurate and controlled system.
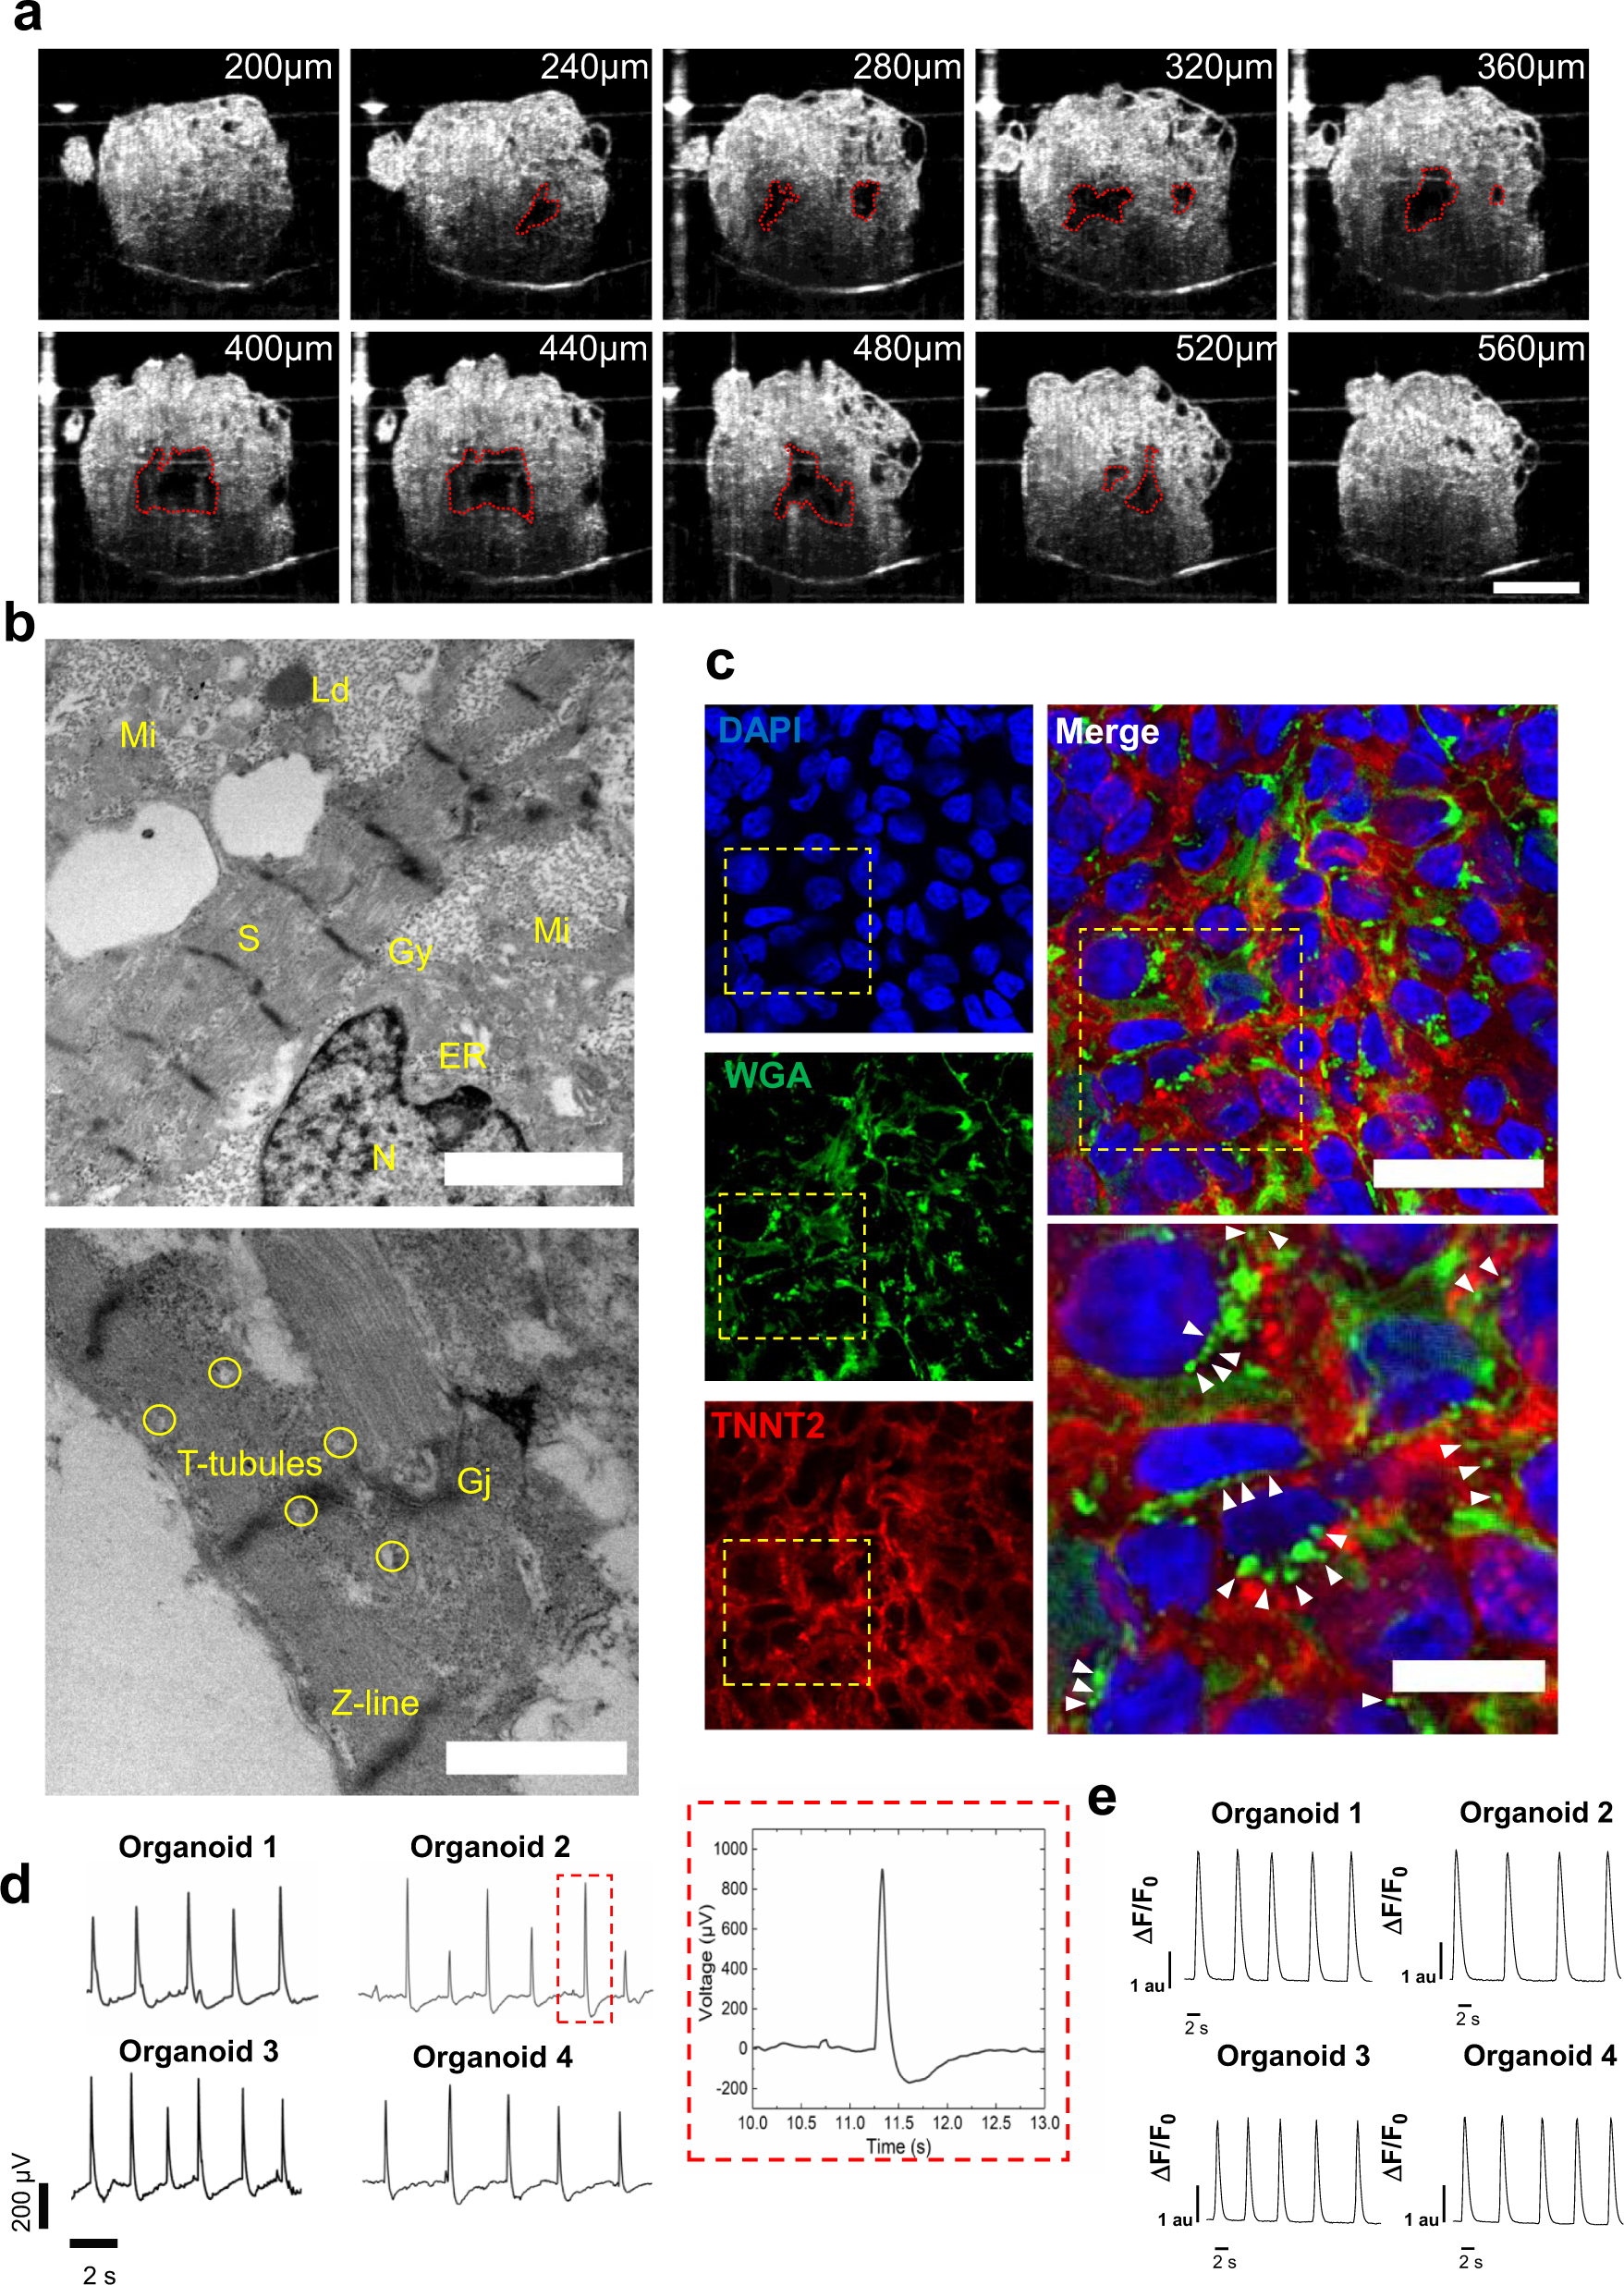
(a) Optical coherence tomography images showing cross-sections through an organoid, revealing chambers; scale bar: 500 µm.
(b) TEM images of hHOs showing endoplasmic reticulum (ER), gap junctions (Gj), glycogen granules (Gy), lipid droplets (Ld), mitochondria (Mi), nucleus (N), and sarcomeres (S); scale bars: 2 µm (top), 1 µm (bottom).
(c) Immunofluorescence images of myocardial tissue in hHOs showing WGA staining of T-tubule-like structures (green); white arrowheads indicate representative T-tubule-like structures between cardiomyocytes; scale bar: 50 µm, inset: 20 µm.
(d) Electrophysiology recordings of 4 organoids on microelectrode array spanning 15 s and a representative action potential wave (inset).
(e) Ca²⁺ transients in 4 representative hHOs after two weeks of differentiation.
Subsequent to the initial publication, our laboratory embarked on the construction of human heart organoids (hHOs) and placed a specific focus on the longitudinal examination of their morphological and functional attributes. We harnessed the capabilities of a customized spectral-domain optical coherence tomography (SD-OCT) system to closely monitor the growth of these hHOs. Our observations through OCT, coupled with calcium imaging, enabled us to visualize the development of chamber structures and beating patterns in these hHOs. The application of OCT provided a rapid, label-free, and non-destructive method to produce comprehensive 3D images, ultimately showcasing the potential of hHOs and OCT as a valuable in vitro platform for exploring heart development and disease mechanisms. Figures X-2 and X-3 utilize OCT imaging to offer detailed 3D renderings and functional characterizations of human heart organoids, shedding light on their structural features, beating patterns, and interbeat intervals.

(A) 3D rendering of the organoid. (B) En face and (C) cross-sectional views of the heart organoid. Scale bars: 200 μm. (D) Segmentation of the organoid and the inside cavities. Cavities in different colors are independent (not connected). Panels A–D show the organoid on day 14. (E) Segmentation of the same organoid on day 16.Heart organoids recapitulate functional and structural features of the developing heart.

(A) hHOs beating characterized by OCT. During contraction, the bottom chamber shrank, and the valve-like structure (indicated by the red arrow) switched to a closed state. (B) HOs beating characterized by fluorescence imaging of GCaMP6f. For panel A and B, 6 representative frames within the same beating cycle were taken from the recordings. All frames were time stamped. The circular arrows indicate the time sequence of each frame group. Scale bars: 200 μm. (C) Traces of hHOs beating. The blue traces on the left represent changes in the height of the chamber, measured from the red dashed box in panel A. The blue traces on the right represent changes in fluorescence intensities of GCaMP6f of the representative binned pixels. (D) Interbeat intervals (IBIs) measured from OCT and calcium imaging. Each marker represents one time interval. Each color represents one hHO. Paired t-test was used to evaluate statistical significance. N = 2 batches, n = 6 hHOs.
Recently, another study was under review, aiming to replicate in vivo cardiac development through self-organization and maturation strategies. By mimicking in utero gestation conditions with metabolic and hormonal signals, the research achieves significant transcriptomic, cellular, morphological, and functional changes, resulting in patterned heart-tube-like structures. In Figure X4, the OCT system is utilized for live longitudinal imaging of human heart organoids, revealing the presence of large, interconnected chambers as demonstrated through OCT cross-sectional scans from day 20 to day 30. These organoids encompass diverse cell populations found in the primitive heart tube, and they demonstrate anterior-posterior patterning due to endogenous retinoic acid gradients, mirroring natural cardiac development. This innovative approach provides a potent in vitro model for investigating the roles of different cell types and genes in human heart development, studying congenital heart defects, and advancing the creation of synthetic human hearts.

(a) Schematic of custom-built optical coherence tomography (OCT) system for human heart organoid imaging. (b) Longitudinal OCT cross-sectional scans of human heart organoids from day 20 to day 30 in each condition. Scale bars = 500 μm. (c) 3D segmentation of OCT scans reveal the temporally dynamic volumetric visualization of chamber identity in each condition.
Our collaborator recently presented a significant advancement in modeling human embryogenesis by utilizing naive human pluripotent stem cells to self-organize into three-dimensional “blastoids.” These blastoids capture key features of post-implantation development, including epiblast lumenogenesis, rapid expansion and diversification of trophoblast lineages, and robust invasion of extravillous trophoblast cells. Extended culture of the blastoids leads to the emergence of embryonic germ layers. Additionally, the study highlights the impact of WNT signaling modulation on the balance between epiblast and trophoblast fates in these post-implantation blastoids. In summary, this research provides a continuous and integrated in vitro model system for studying human embryonic and extraembryonic development, spanning from pre-implantation to early gastrulation stages. Figures X-4 collectively depict the efficient formation of blastoids from naive hPSCs with time course images, immunofluorescence confocal imaging, and OCT imaging. Figure X-4 (E-G) utilized the benefits of OCT imaging, showcasing the top-down and side views of aggregates, 3D reconstruction of OCT images revealing the ICM’s localization within a cavitated blastoid, and quantification of ICM position in individual microwells, offering comprehensive insights into the development of these structures.

(A) Schematic representation of the optimized blastoid formation protocol.
(B) Time course images of 3 representative blastoids generated from WIBR3 OCT4-GFP naive hPSCs over 7 days of culture. Scale bar, 200 μm.
(C) Maximum projection IF confocal imaging of a WIBR3 OCT4-GFP blastoid at day 7. OCT4 indicates blastoid bEPI, GATA3 marks surrounding blastoid bTE, and SOX17 marks bPE. Scale bar, 100 μm.
(D) 3D maximum projection IF images (top) and ICM-centered planes (bottom) of WIBR3 blastoids indicate additional markers of bEPI and bTE. bEPI markers include OCT4, SOX2, and IFI16. bTE markers include CGA, TEAD1, NR2F2, ZO-1, and nuclear YAP. DAPI indicates nuclei, and F-actin indicates cytoskeleton. Scale bar, 100 μm.
(E) Analysis of ICM position and blastocoel cavity formation performed with OCT imaging over 6 days of blastoid formation from WIBR3 OCT4-GFP naive hPSCs. The top row of images shows a top-down view of aggregates proliferating between days 2 and 4 with cavitation occurring at day 6. The red dotted line indicates the transverse plane used to visualize the side view of the blastoids forming blastocoel cavities at 6 days. Scale bar, 400 μm.
(F) 3D reconstruction of an OCT image showing the localization of the ICM in a single cavitated blastoid. The white dashed line circles the manually segmented ICM shown in red. The green and yellow squares project the slices in the 3D view. The cross section highlighted in green shows a densely packed, localized ICM surrounded by TE and a blank inner blastocoel cavity. The yellow perpendicular plane highlights the en face view. Scale bar, 100 μm.
(G) Quantification of ICM position within individual microwells. Data were quantified among 3 separate regions, total number of blastoids counted = 141.
Three-dimensional (3D) tumor spheroid models have gained increased recognition as important tools in cancer research and anti-cancer drug development. However, currently available imaging approaches employed in high-throughput screening drug discovery platforms e.g. bright field, phase contrast, and fluorescence microscopies, are unable to resolve 3D structures deep inside (>50 μm) tumor spheroids. In this study, we established a label-free, non-invasive optical coherence tomography (OCT) imaging platform to characterize 3D morphological and physiological information of multicellular tumor spheroids (MCTS) growing from ~250 μm up to ~600 μm in height over 21 days. In particular, tumor spheroids of two cell lines glioblastoma (U-87 MG) and colorectal carcinoma (HCT 116) exhibited distinctive evolutions in their geometric shapes at late growth stages. Volumes of MCTS were accurately quantified using a voxel-based approach without presumptions of their geometries. In contrast, conventional diameter-based volume calculations assuming perfect spherical shape resulted in large quantification errors. Furthermore, we successfully detected necrotic regions within these tumor spheroids based on increased intrinsic optical attenuation, suggesting a promising alternative of label-free viability tests in tumor spheroids. Therefore, OCT can serve as a promising imaging modality to characterize morphological and physiological features of MCTS, showing great potential for high-throughput drug screening.
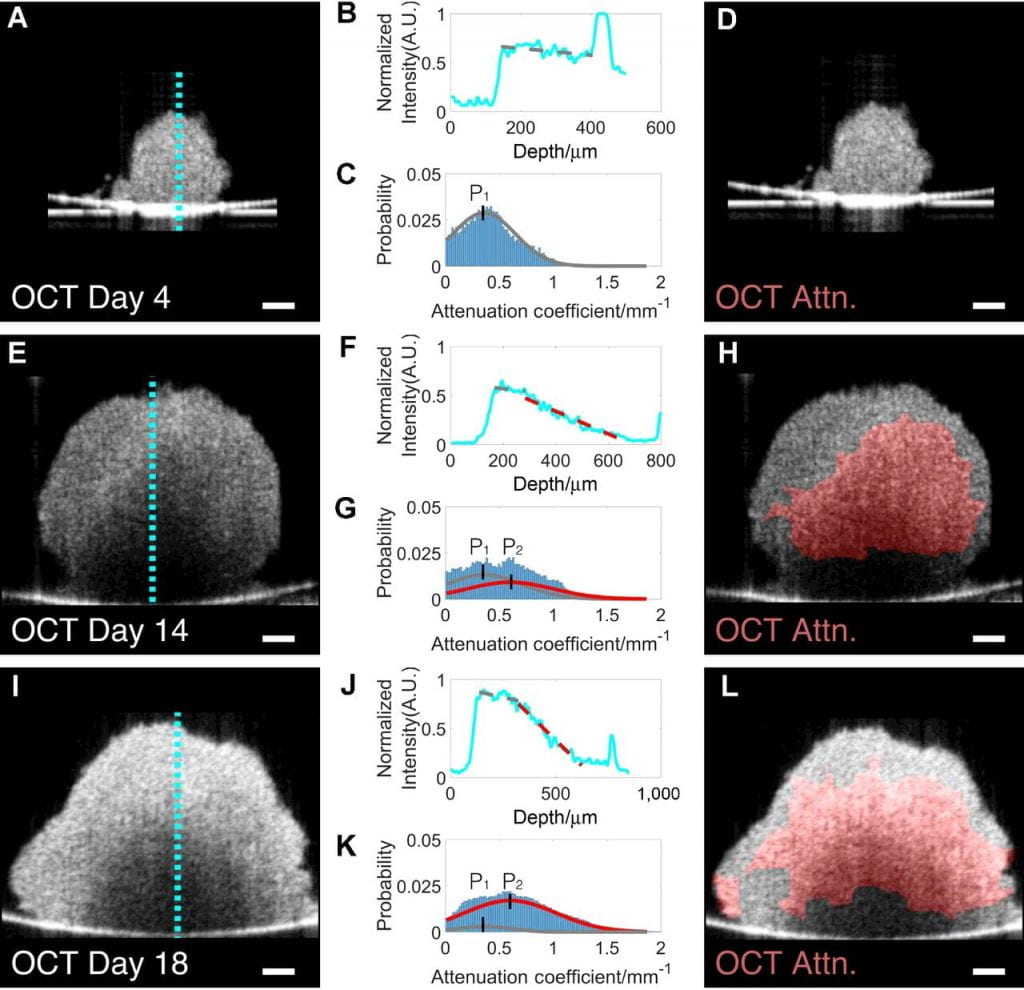
Figure: Determination of necrotic regions of HCT116 tumor spheroids on days 4, 14, and 18 based on intrinsic optical attenuation contrast. The backscattered signals in cross-sectional OCT images (A, E, and I) were used to derive intensity profiles along each axial scan line (B, F, and J). High attenuation regions (indicated by red lines in F and J) could be clearly observed in the intensity profiles of the tumor spheroids on days 14 and 18 (F and J), but not on the tumor spheroid on day 4 (B). Further analyses of optical attenuation coefficient histograms (C, G, and K) were performed to determine the threshold to separate low and high attenuation regions (i.e., 0.48/mm), which is calculated as the median of the two peak values (P1 = 0.36/mm, P2 = 0.60/mm). High-attenuation regions above the threshold highlighted in red (H and L) were detected as the necrotic cores in the tumor spheroids. The region of necrotic tissue clearly increased as the spheroid developed. Scale bars, 100 μm.
Ovarian tissue cryopreservation has been successfully applied worldwide for fertility preservation. Correctly selecting the ovarian tissue with high follicle loading for freezing and reimplantation increases the likelihood of restoring ovarian function, but it is a challenging process. In this work, we explore the use of three-dimensional spectral-domain optical coherence tomography (SD-OCT) to identify different follicular stages, compare the identifications with H&E images, and measure the size and age-related follicular density distribution differences in mice ovaries. We use the thickness of the layers of granulosa cells to differentiate primordial and primary follicles from secondary follicles. The measured dimensions and age-related follicular distribution agree well with histological images and physiological aging. Finally, we apply attenuation coefficient map analyses to significantly improve the image contrast and the contrast-to-noise ratio (p < 0.001), facilitating follicle identification and quantification. We conclude that SD-OCT is a promising method to noninvasively evaluate ovarian follicles for ovarian tissue cryopreservation.
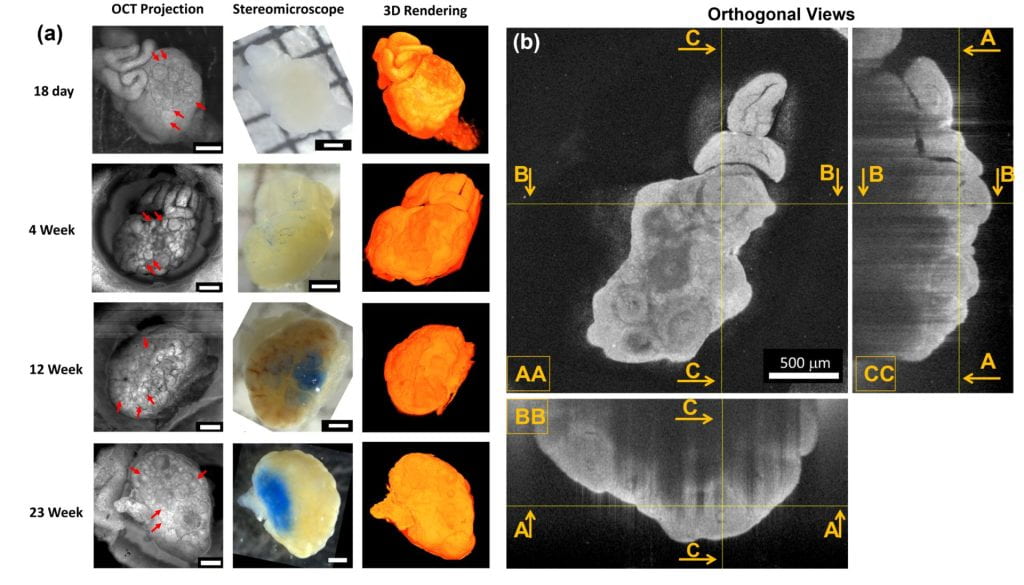
(a) En face projections of an OCT image (left) and stereomicroscope images (center) and OCT renderings (right) of 18-day-old, 4, 12, and 23-week-old mice ovaries. Red arrows point to examples of follicles highlighted by the OCT projection. (b) Three orthogonal views of the 3D OCT dataset: ([AA] top view, [BB] front view, [CC] left view). Scale bar, 500 µm.
OCT with Machine Learning
Deep learning is a powerful tool for image processing, such as segmentation and classification. Recently, we have researched and developed deep learning methods for identification and segmentation the heart region of Drosophila at different developmental stages in the cross-sectional images acquired by our customized OCM system. With our well-trained deep learning model, the heart regions through multiple heartbeat cycles can be marked with an intersection over union of ~86%, and further improved to ~92%. Various morphological and dynamical cardiac parameters can be quantified accurately with automatically segmented heart regions. This study demonstrates an efficient heart segmentation method to analyze OCM images of the beating heart in Drosophila.
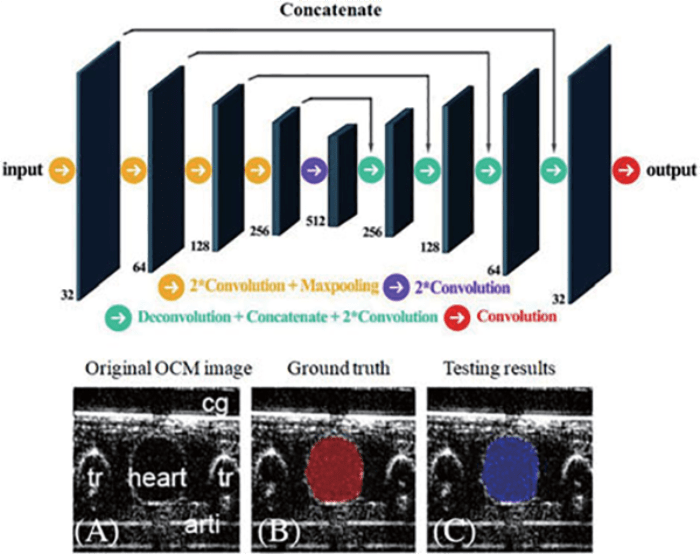
Figure: Segmentation of Drosophila heart in OCM images using convolutional neural networks.Convolutional neural networks (CNNs) are powerful tools for image segmentation and classification. Here, we use this method to identify and mark the heart region of Drosophila at different developmental stages in the cross-sectional images acquired by a custom optical coherence microscopy (OCM) system. With our well-trained CNN model, the heart regions through multiple heartbeat cycles can be marked with an intersection over union of ~86%. Various morphological and dynamical cardiac parameters can be quantified accurately with automatically seg-mented heart regions. This study demonstrates an efficient heart segmentation method to analyze OCM images of the beating heart in Drosophila.
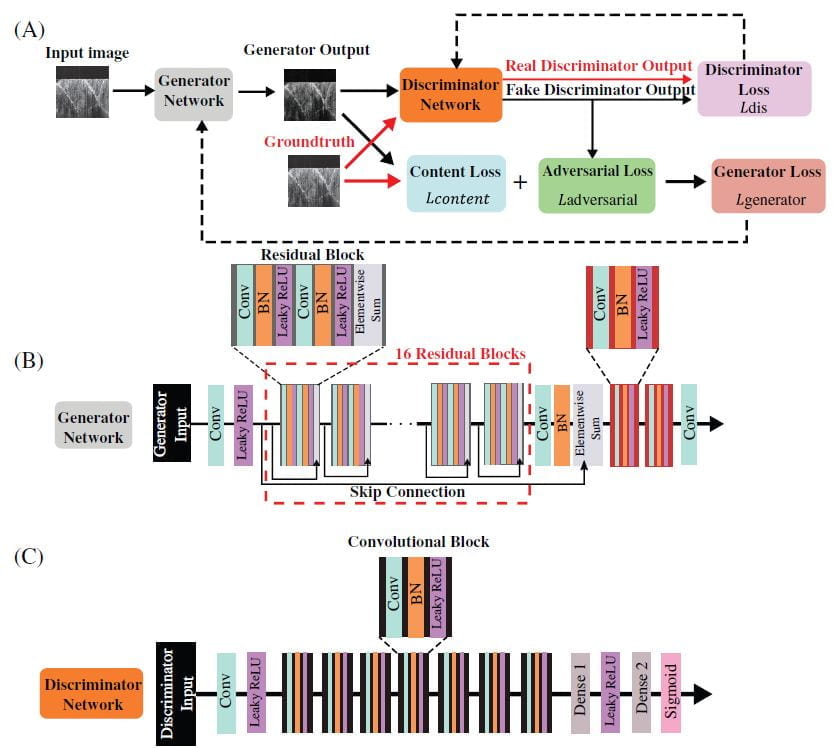
Speckle noise is a key factor affecting OCT image quality. Here, we developed a custom generative adversarial network (GAN) to denoise OCT images. A speckle-modulating OCT (SM-OCT) was built to generate low speckle images to be used as the ground truth. In total, 210 000 SM-OCT images were used for training and validating the neural network model, which we call SM-GAN. The performance of the SM-GAN method was further demonstrated using online benchmark retinal images, 3D OCT images acquired from human fingers and OCT videos of a beating fruit fly heart. The denoise performance of the SM-GAN model was compared to traditional OCT denoising methods and other state-of-the-art deep learning based denoise networks. We conclude that the SM-GAN model presented here can effectively reduce speckle noise in OCT images and videos while maintaining spatial and temporal resolutions.
